
The bear flag pattern is a commonly observed chart formation in technical analysis that can provide valuable insights into the future direction of a stock or other financial instrument. This pattern is often seen during prolonged downtrends and can signal a continuation of the bearish trend. Understanding the bear flag pattern and how to analyze it can be an essential tool for traders and investors.
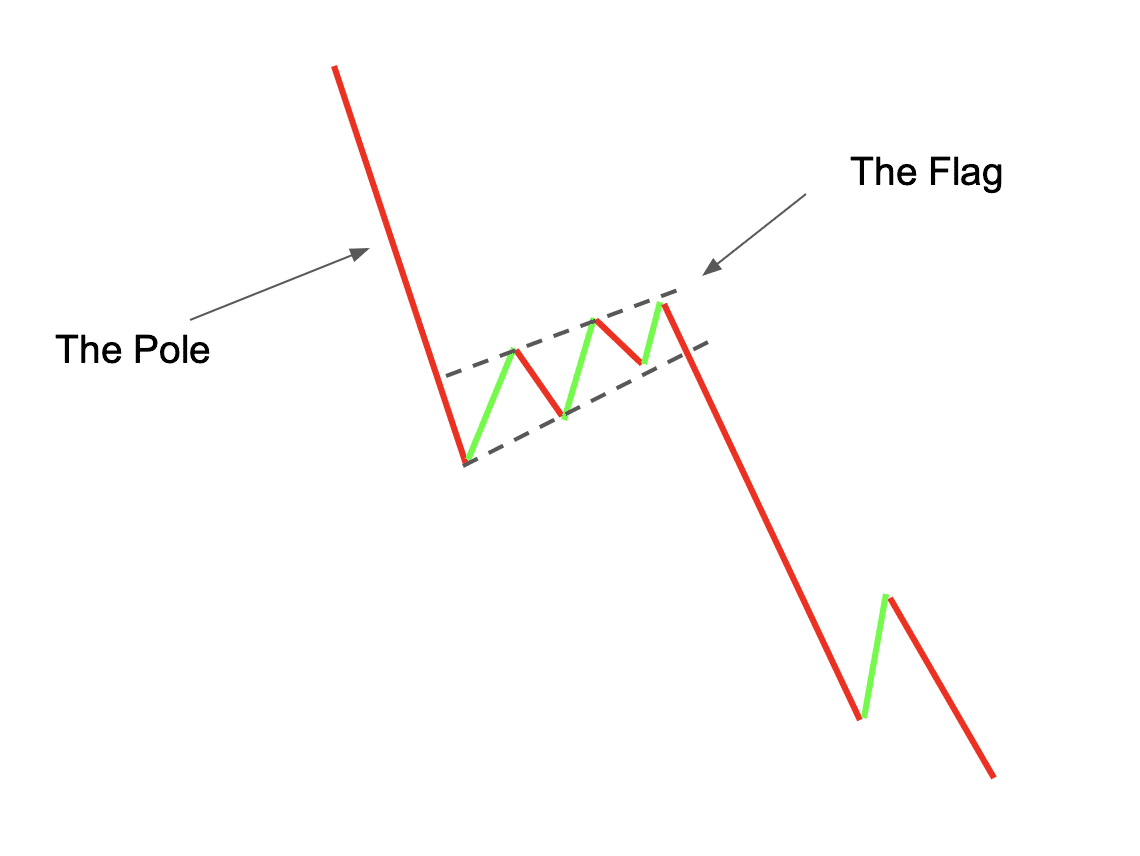
In its simplest form, a bear flag pattern consists of two components: a flagpole and a flag. The flagpole is formed by a sharp decline in price, representing the initial bearish move. This is followed by a period of consolidation, where prices trade in a narrow range and form the flag portion of the pattern. The flag is typically a downward sloping channel or a horizontal rectangle.
An important characteristic of the bear flag pattern is the volume. During the formation of the flagpole, volume tends to be high as traders and investors react to the initial decline in price. As the pattern progresses, volume generally decreases during the consolidation phase. This indicates a decrease in selling pressure and suggests that the bears are losing momentum.
Once the bear flag pattern is identified, traders often look for a breakout below the lower trendline of the flag to confirm the continuation of the downtrend. This breakout is often accompanied by an increase in volume and can provide a signal to enter a short position or add to an existing one. However, it’s important to note that not all bear flag patterns lead to a continuation of the bearish trend. Traders should always use additional technical analysis tools and indicators to confirm their trading decisions.
Understanding the Bear Flag Pattern
The bear flag pattern is a popular chart pattern used by traders to identify potential bearish trends in the market. It gets its name from the way it looks on a price chart, resembling a flagpole with a flag at the top. This pattern is typically seen during a downtrend and signals a continuation of the bearish trend.
- Formation: The bear flag pattern is formed when there is a sharp decline in price, followed by a period of consolidation. During the consolidation phase, the price moves in a narrow range, forming a flag pattern that slopes downward.
- Duration: The flag portion of the pattern can last from a few days to several weeks, depending on the timeframe of the chart being analyzed. The longer the flag formation, the more significant the potential decline can be.
- Volume: Volume plays a crucial role in confirming the bear flag pattern. Ideally, volume should decrease during the consolidation phase and increase when the price breaks below the flag, indicating a strong selling pressure.
- Breakout: A valid bear flag pattern is confirmed when the price breaks below the lower trendline of the flag. Traders often look for a significant increase in volume at the breakout point as a confirmation signal.
Once the bear flag pattern is confirmed, traders can anticipate further downside movement in the market. They may consider taking short positions or exiting existing long positions to capitalize on the expected decline in price.
However, it is important to note that not all bear flag patterns result in a significant decline. Therefore, it is crucial to use proper risk management techniques and consider other technical indicators and market factors before making any trading decisions.
By understanding and recognizing the bear flag pattern, traders can gain an edge in identifying potential bearish trends and take advantage of potential profit opportunities in the market.
What is the Bear Flag Pattern?
The bear flag pattern is a popular chart formation that is used in technical analysis to predict the continuation of a downtrend. It is named after its resemblance to a bear climbing a flagpole. This pattern is typically seen during a consolidation period in a downtrend and signals that the bears are likely to regain control and push the price lower.
The bear flag pattern is formed by two main components: a flagpole and a flag. The flagpole is the initial sharp decline in price, which represents the bears’ strong selling pressure. This is followed by a period of consolidation, where the price moves sideways in a narrow range. This forms the flag, which is usually sloping downwards.
Traders look for specific characteristics in the bear flag pattern to confirm its validity. These include a strong and sharp decline in price followed by a flag that is well-defined and sloping downward. The volume should also decrease during the consolidation period, indicating a lack of buying interest.
Once the bear flag pattern is confirmed, traders can use it to make trading decisions. One common strategy is to go short (sell) when the price breaks below the lower support level of the flag. This breakout is seen as a signal that the bears are taking control and that the downtrend is likely to continue.
It is important for traders to use proper risk management techniques when trading the bear flag pattern, as false breakouts can occur. Stop-loss orders can be placed above the upper resistance level of the flag to limit potential losses if the price reverses.
In conclusion, the bear flag pattern is a powerful tool for predicting the continuation of a downtrend. By identifying this pattern and understanding its characteristics, traders can make more informed trading decisions and increase the likelihood of success in the market.
How to Identify the Bear Flag Pattern
The bear flag pattern is a popular chart pattern used by traders to identify potential bearish reversals or continuations in a stock or security’s price trend. The pattern gets its name from its resemblance to a flag on a flagpole, with a relatively sharp initial decline (the flagpole) followed by a period of consolidation or sideways movement (the flag).
Here are the key steps to identify the bear flag pattern:
- Look for a significant and sharp price decline in the stock or security’s price. This decline should be followed by a period of consolidation or sideways movement.
- During the consolidation phase, the stock or security’s price should form a downward sloping trendline (the flagpole) that connects the high points of the consolidation phase. This represents the selling pressure that is pushing the stock downwards.
- Next, look for a break of the trendline that signals a potential continuation of the downtrend. This is typically indicated by a sharp decline in price volume.
- Confirm the pattern by identifying a target price. To do this, measure the height of the flagpole (the distance from the high point to the low point) and subtract it from the breakout price. This provides an estimate of the potential decline in price.
- Finally, confirm the pattern by looking for other technical indicators or signals that support the bearish outlook. This could include overbought conditions, bearish chart patterns, or negative divergences.
It is important to note that not all bear flag patterns lead to significant declines in price. Therefore, it is always recommended to use other technical analysis tools and indicators to confirm the signal and manage risk.
Key Characteristics of the Bear Flag Pattern
The Bear Flag Pattern is a popular chart pattern that is used by traders to identify potential bearish trends in the market. It is formed when a stock or an asset experiences a sharp decline in price followed by a period of consolidation, and then another sharp decline in price. The pattern resembles a flagpole with a flag, hence the name Bear Flag Pattern.
1. Sharp Decline:
The first characteristic of the Bear Flag Pattern is a sharp decline in price. This decline is usually caused by a overall negative sentiment in the market or negative news specific to the stock or asset. The sharp decline creates a bearish outlook for the future price movement.
2. Consolidation:
After the sharp decline in price, the stock or asset enters a period of consolidation. Consolidation is when the price of an asset trades within a narrow range, with little to no movement. This period represents a temporary pause in the bearish momentum and allows traders to determine the next potential price direction.
3. Another Sharp Decline:
Once the consolidation phase is over, the stock or asset experiences another sharp decline in price. This decline confirms the bearish outlook and signals that the downward trend is likely to continue. Traders can use this second decline as a signal to enter a short position or sell their existing position.
It is worth noting that the Bear Flag Pattern is typically seen as a bearish continuation pattern, meaning that it suggests the downward trend is likely to continue. However, it is important to use other technical analysis tools and indicators to confirm the reliability of the pattern and make informed trading decisions.
Analyzing Price Movements in the Bear Flag Pattern
The bear flag pattern is a popular technical analysis tool used by traders to identify potential bearish trends in the market. It is formed when a stock or any other asset experiences a sharp decline in price, followed by a brief consolidation phase before resuming its downward movement.
Identifying the Bear Flag Pattern
To identify a bear flag pattern, traders look for specific characteristics in the price chart. These include:
- A sharp and significant decline in price, known as the flagpole.
- A consolidation phase, also known as the flag, which is characterized by a sideways or slightly upward price movement.
- A continuation of the downward movement after the consolidation phase.
By recognizing these patterns, traders can anticipate further declines in the price of the asset and make informed trading decisions.
Understanding Price Movements in the Bear Flag Pattern
The bear flag pattern represents a temporary pause or a period of indecision in the market after a significant bearish move. During the consolidation phase, buyers and sellers are in a tug-of-war, resulting in a sideways or slightly upward movement in price.
However, this consolidation is typically short-lived as sellers regain control and push the price lower, resuming the original downtrend. This continuation of the downward movement is often accompanied by high trading volume, indicating strong selling pressure.
Traders analyze the price movements within the bear flag pattern to determine the potential target for the downward move. They may use technical indicators, support and resistance levels, and other tools to identify possible price targets.
It is important to note that not all bear flag patterns will result in a significant decline in price. Traders must consider other factors such as market conditions, news events, and overall trend before making trading decisions based solely on the bear flag pattern.
In conclusion, analyzing price movements in the bear flag pattern provides valuable insights into potential bearish trends in the market. By identifying and understanding this pattern, traders can increase their trading accuracy and make more informed decisions.
Understanding Volume in the Bear Flag Pattern
Volume is an important aspect to consider when analyzing the bear flag pattern in stock trading. It provides insights into the strength or weakness of the pattern, and can help traders make more informed decisions.
What is Volume?
Volume refers to the number of shares or contracts traded in a given security during a specific period of time. It is represented as a histogram or a bar chart at the bottom of a price chart. Volume is an indication of market activity and liquidity, and can provide valuable information to traders.
Volume and the Bear Flag Pattern
In the context of the bear flag pattern, volume can provide clues about the pattern’s reliability. Ideally, when a stock forms a bear flag pattern, the volume should decrease as the pattern develops. This indicates that traders are losing interest and that the downward momentum is weakening.
However, if the volume remains high or starts to increase as the bear flag pattern forms, it suggests that there is still a significant amount of selling pressure in the market. This can be a warning sign that the pattern may not play out as expected, and that the stock could continue to decline.
Traders should also pay attention to volume when the bear flag pattern breaks down. If there is a surge in volume when the price breaks below the flag’s support line, it indicates that selling pressure has intensified and the stock may experience a more significant decline.
On the other hand, if the price breaks down from the bear flag pattern on low volume, it suggests that the pattern may not be as reliable and the stock could potentially reverse its downward trend.
It’s important to note that volume should always be analyzed along with other technical indicators and price action to get a more comprehensive understanding of the bear flag pattern and the overall market conditions.
In conclusion, volume is a valuable tool in analyzing the bear flag pattern. It can help traders gauge the strength or weakness of the pattern and make better trading decisions. Proper interpretation of volume can improve the accuracy of trading strategies and increase the chances of success in the stock market.
Trading Strategies for the Bear Flag Pattern
When it comes to trading the bear flag pattern, there are a few strategies that traders can use to capitalize on this common chart pattern. Here are three popular strategies:
1. Breakout Strategy
The breakout strategy involves waiting for the bear flag pattern to form and then entering a trade when the price breaks below the support level indicated by the lower trendline of the flag. Traders can set a stop-loss order just above the flag’s upper trendline to protect against potential losses. The profit target can be set at a level equivalent to the height of the flagpole.
2. Pullback Strategy
The pullback strategy involves waiting for the price to break below the support level and then waiting for a pullback or retracement to the broken support level. Traders can enter a short trade when the price returns to the broken support level, with a stop-loss order set just above the previous support level. The profit target can be set at a level equivalent to the height of the flagpole.
3. Range Strategy
The range strategy involves trading within the boundaries of the bear flag pattern. Traders can enter short trades when the price reaches the upper trendline of the flag and exit the trade when the price reaches the lower trendline. This strategy can be used in a range-bound market where the price moves sideways within the flag pattern.
It’s important to note that no trading strategy is foolproof, and traders should always use proper risk management techniques and consider other technical indicators and analysis to confirm the validity of the bear flag pattern before entering a trade.
By using these trading strategies, traders can potentially profit from the bear flag pattern by taking advantage of price movements and trends within the pattern.
Limitations and Risks of the Bear Flag Pattern
The Bear Flag Pattern is a commonly used technical analysis tool in the stock market, but it is important to be aware of its limitations and associated risks before relying solely on this pattern to make trading decisions.
1. False Signals:
One of the main limitations of the Bear Flag Pattern is that it can produce false signals. Sometimes, the price may exhibit the characteristics of a bear flag, but it may not actually lead to a continuation of a downtrend. This can result in traders entering positions based on the pattern, only to see the price reverse and move in the opposite direction.
2. Market Volatility:
The Bear Flag Pattern may be less effective in highly volatile markets. During periods of extreme market volatility, patterns may be less reliable as market forces can quickly override the historical price patterns. Therefore, it is important to consider the overall market conditions and other technical indicators in conjunction with the pattern analysis.
| Limitation | Risk Mitigation |
|---|---|
| False Signals | Confirm the pattern with other technical indicators such as volume and trend lines. |
| Market Volatility | Consider the overall market conditions and use other technical analysis tools alongside the pattern. |
| Timing | Ensure the pattern is validated by waiting for a breakout or confirmation before taking actions. |
3. Timing:
Timing is crucial when trading based on the Bear Flag Pattern. It is important to wait for a breakout or confirmation of the pattern before taking any actions. Entering too early or too late can result in missed opportunities or losses. Therefore, traders should exercise patience and wait for a reliable entry point.
In conclusion, while the Bear Flag Pattern can be a useful tool for analyzing and predicting market trends, it is important to be aware of its limitations and associated risks. By considering other technical indicators, market conditions, and timing, traders can increase the accuracy and effectiveness of their trading decisions.
Q&A: Bear flag pattern
What is a bear flag pattern?
A bear flag pattern is a technical analysis pattern that is formed when a stock price experiences a significant decline, followed by a slight recovery, and then continues to decline.
How can I identify a bear flag pattern?
You can identify a bear flag pattern by looking for a sharp drop in price, followed by a consolidation phase where the price moves in a small range and forms a flag-like shape.
What does a bear flag pattern indicate?
A bear flag pattern indicates that there is a strong possibility of further downward movement in the stock price, as it suggests that the market is still bearish and the sellers are still in control.
How can I trade a bear flag pattern?
To trade a bear flag pattern, you can wait for the price to break below the flag portion of the pattern and enter a short position. You can then set your stop loss above the flag portion and target a profit level based on the height of the flagpole.
Can a bear flag pattern be seen on different time frames?
Yes, a bear flag pattern can be seen on different time frames, including daily, weekly, and intraday charts. The pattern is valid regardless of the time frame it appears on.
Published by the author


Verified by an expert